Analysis of microscopy data#
Microscopy experiments aim to answer questions about underlying biological or physical objects. As discussed in Designing microscopy experiments experiment design should start with specific question. Data analysis then can help answer these questions, focusing on:
signal amount (is X brighter than Y?)
number of objects (are there more dim cells or bright cells?)
geometry (are objects type A longer than objects type B?)
temporal events (how big is the change in parameter X over time?)
It is not as important to specifically categorize your question, but rather to focus on articulating what is that exactly you want to know about underlying dataset. Here we provide few general recommendations and example analysis pipelines together with datasets.
Excel is not good enough#
Intensity-based analysis that focuses on measuring amount of signal in space or time traditionally was done using tabulated data formats software. Excel is general-purpose tool and used widely, other similar tools include SPSS, Stata, or MATLAB. These tools are no longer sufficient to satisfy FAIR requirements. Using scripting languages such as Python allows user to program analysis, re-run analysis later, check for any errors, track changes to algorithm, and share code during peer-review, while keeping raw data essentially un-touched. Similar can be done using tabulated software but much harder in practice.
Scripting data analysis after manual pre-processing#
Instead of using tables and risk losing data or confusing columns, we should script analysis using established libraries such as numpy and scipy, which will also allow plotting and formatting of figures.
# process data to normalize time series between 0 and 1 for each sample
import numpy as np
fname = 'data.csv'
data = np.loadtxt(fname, delimiter=",")
# data is a 2D matrix: time x samples
[Nt, Nsamples] = shape(data)
#
data_norm = np.zeros((Nt, Nsamples)) # copy data to be normalized
for i in range(0, Nsamples): # iterate over samples
  data_norm[:, sample_index] = (data[:, i] - np.min(data[:, i]))/np.max( data[:, i] - np.min(data[:, i]) )
Compare that code to similar analysis in Excel:
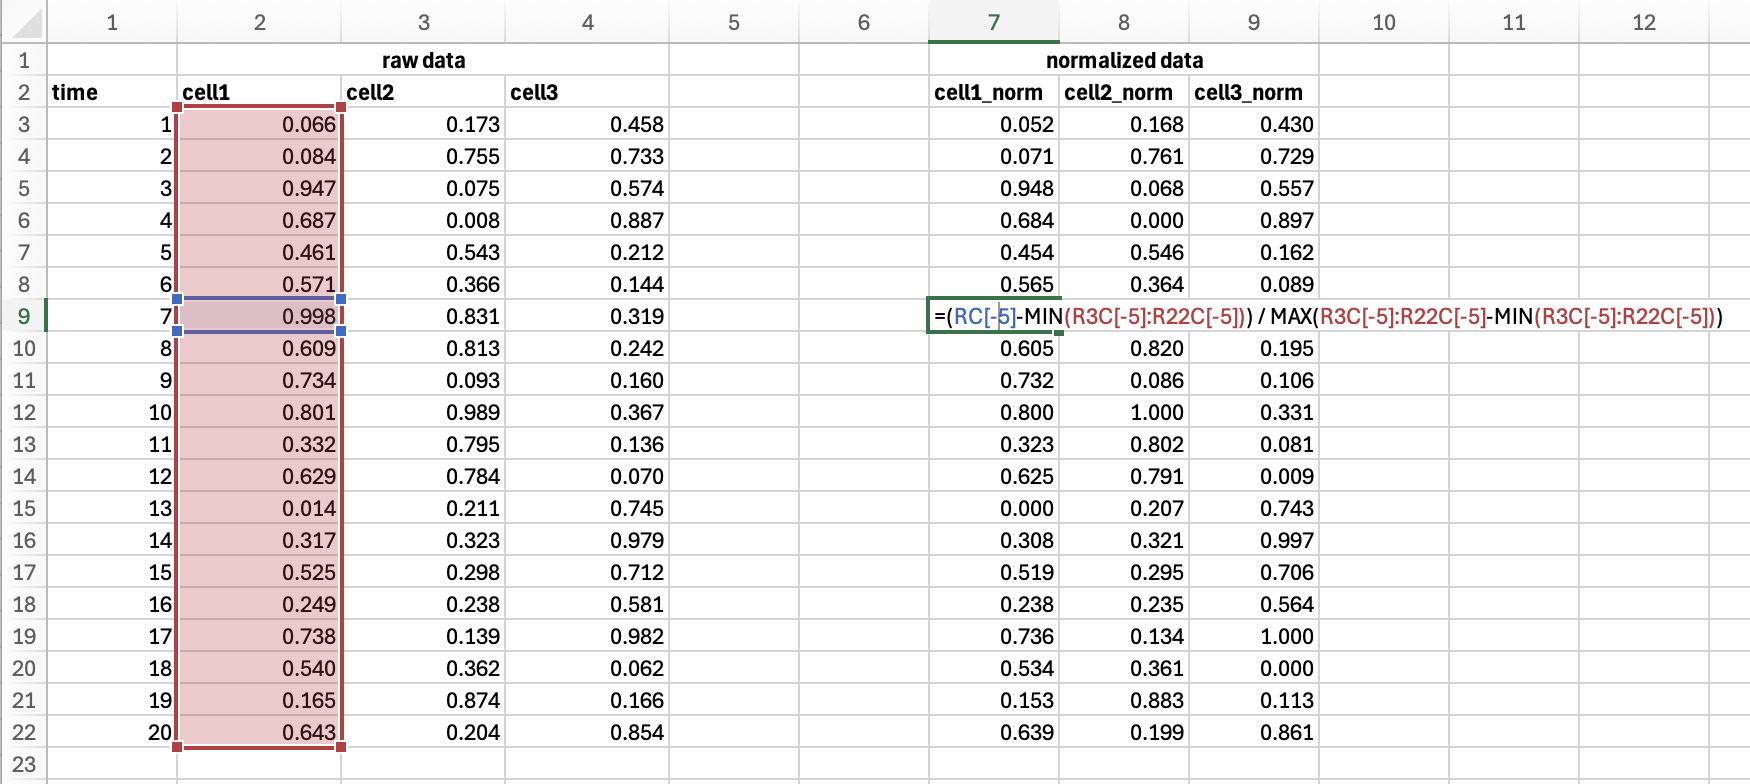
Using scripting allows rapid processing of large datasets from multiple individual experiments stored as individual files. This way users can modify parameters of analysis and quickly re-process the whole datasets or perform re-rendering with new style of graphics.
Automatic processing#
When we move data processing to realm of software we can start integrating automatic and on-the-fly analysis. Common image acquisition platforms such as Micro-Manager and Napari provide tooling for live data analysis. For example, see this demo. Example processing can include FLIM analysis, de-noising / deconvolution, on-the-fly frequency analysis, tracking, and more.